Data Scraping
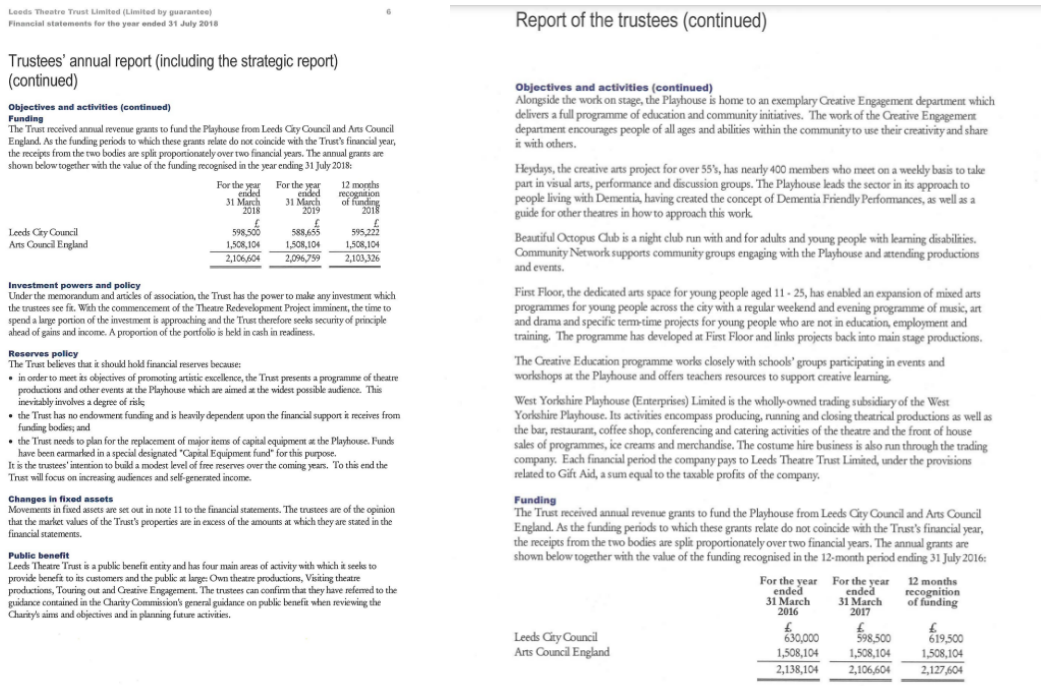
The above data is a grab of information from the British Theatre Survey, distribution of income generated by subsidized theaters in England from 2020 to 2023
Supplementary notes
Earned income: all income generated by the organizations' own activities.
Arts Council England subsidy: including government and lottery funding.
Contributed income: including sponsorships from business organizations, income from trusts or foundations, and the public (where no benefit is received in return).
Local authority subsidy: subsidies received from local authorities, including revenue and project funding.
Other public subsidy: including grants received from all other public sources.
By scraping the information from past fund building fundraisers, it can be learnt that in 1969, there were a total of two fundraising fundraising plans. Plan A and Plan B, respectively. Plan A was ultimately used. Specific data can be found in the table below.
| Date |
Cash requirement |
Cash availability from: |
Reaidual from our Funds |
|
|---|---|---|---|---|
| Arts Council | City Council | |||
|
20 July 69 1 Noy 69 1 Reb 70 |
7,000 30,000 30,000 |
5,000 15,000 25,000 |
- 12,500 - |
2,000 2,500 5,000 |
|
Sub, Total y.y 69/70 |
67,000 | 45,000 | 12,500 | 9,500 |
|
6 Apr. 70. 1 Aug 70 1 Nar 71 |
30,000 48,000 5,000 |
(i) - (i0) - - |
12,500 - - |
(i) 17,500 (ii) (12,500) 48,000 5,000 |
|
Sub Total.F.Y. 70/71 |
83,000 | - | 12,500 |
(i) 70,500 (ii) 70,000 |
| TOTAL | 15,000 | (i) 45,000 | 25,000 | (i) 80,000 |
| (ii) 50,000 | (ii) 75,000 | |||
|
Pinancial Year |
Months |
Caah RoQuirement |
Arts Council. | City Council. |
Residual from Own Funds |
|---|---|---|---|---|---|
|
1969/70 1970/71 |
100 4* |
67,000 83,000 |
10,000 35,500 |
12,500 12,500 |
34,500 45,500 |
| TOTAL | 150,000 | 45,000 | 25,000 | 80,000 |
| Date |
Cash Required $ |
Thentro Trust (Cash) |
Arts Council |
City Council |
Gulbenkian Foundation |
Theatre Trust Borrowing |
|---|---|---|---|---|---|---|
| 1969 lat Oot | 8,500 | 8,500 | - | - | - | - |
| lst Nov | NIL | - | - | - | - | |
| lst Dec | 7,500 | 7,500 | - | - | - | |
| 1970 lst Jan | 20,000 | 2,500 | 5,000 | 12,500 | - | - |
| lst Feb | 5,000 | 5,000 | - | - | - | - |
| lst Feb | 5,000 | 5,000 | - | - | - | - |
| lst April | 9,000 | 4,000 | 5,000 | - | - | - |
| SUB TOTAL 1969/70 | 55,000 | 32,500 | 10,000 | 12,500 | - | - |
| lst May | 13,000 | 3,000 | - | 10,000 | - | - |
| lst June | 13,000 | 3,000 | 7,500 | 2,500 | - | - |
| lst July | 13,000 | 3,000 | 10,000 | - | - | - |
| lst Aug | 13,000 | 3,000 | 10,000 | - | - | - |
| lst Sept | 13,000 |
(A) 5,500 (B) 3,100 |
7,500 | - | - |
(A) NIL (B) 2,400 |
| lst Oct | 28,000 |
(A) 10,000 (B) NIL |
- | - | 17,400 |
(A) NIL (B) 10,600 |
| 1971 lat March | 2,000 |
(A) 2,000 (B) NIL |
- | - | - |
(A) NIL (B) 2,000 |
| TOTAL "A" | 150,000 | 62,600 | 45,000 | 25,000 | 17,400 |
(A) NIL |
| TOTAL "B" | 150,000 | 47,600 | 45,000 | 25,000 | 17,400 |
(B) 15,000 |
Since Plan A was eventually adopted the trend of fund raising can be seen in the line graph:
The final mobilization of funds is shown in the figure below:
From the modern mobilisation data that can be found so far, it is known that
Gathering the available data from this can result in a simple table of funds representing fundraising for the period
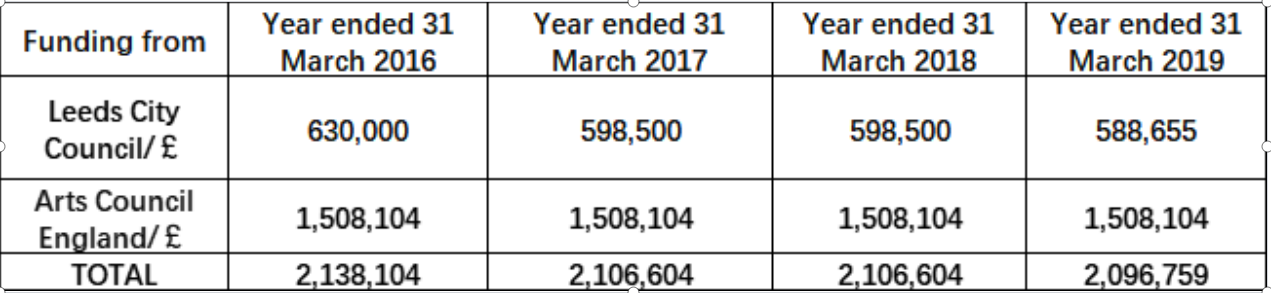
More and more funds are now being raised and supported by larger governments, and the relevant allocations tend to be fixed. The increased allocation of funds over time has likely enabled Leeds Playhouse to expand these initiatives, thereby enhancing its ability to attract and engage audiences, support artists, and contribute significantly to the cultural vibrancy of Leeds.